F1GMAT · https://premium.f1gmat.com/technology/trends/2026/Q2 ·
 Add F1GMAT as a preferred source on Google, opens Google in a new tab
 See more of F1GMAT's MBA admissions research in Google's Top Stories by making us a preferred source on Google.
While Q1 2026 focused on the power required to scale AI and the governance framework needed for deployment, Q2 2026 shifted to measurable ROI for each AI deployment, starting with the unit economics of AI models.
The worry was prominent among Enterprise buyers, who faced rising token bills from volume-obsessed employees. It is not their fault when leadership demands productivity based on volume. Caught in the conundrum, leadership was forced to look at cheaper open models.
Equity investors, in protest of rising CAPEX of hyperscalers, sold their shares and rewarded the ones that showed discipline or breakthroughs in frontier AI intelligence.
Citizens protested against the noise and water pollution data centers brought to their neighborhood.
The Q2 Technology Industry trends theme is accountability, unit economics, and rewarding performance.
The eight trends below track that shift across capital markets, enterprise buying, silicon, energy, labor, and regulation.
TL;DR (Summary)
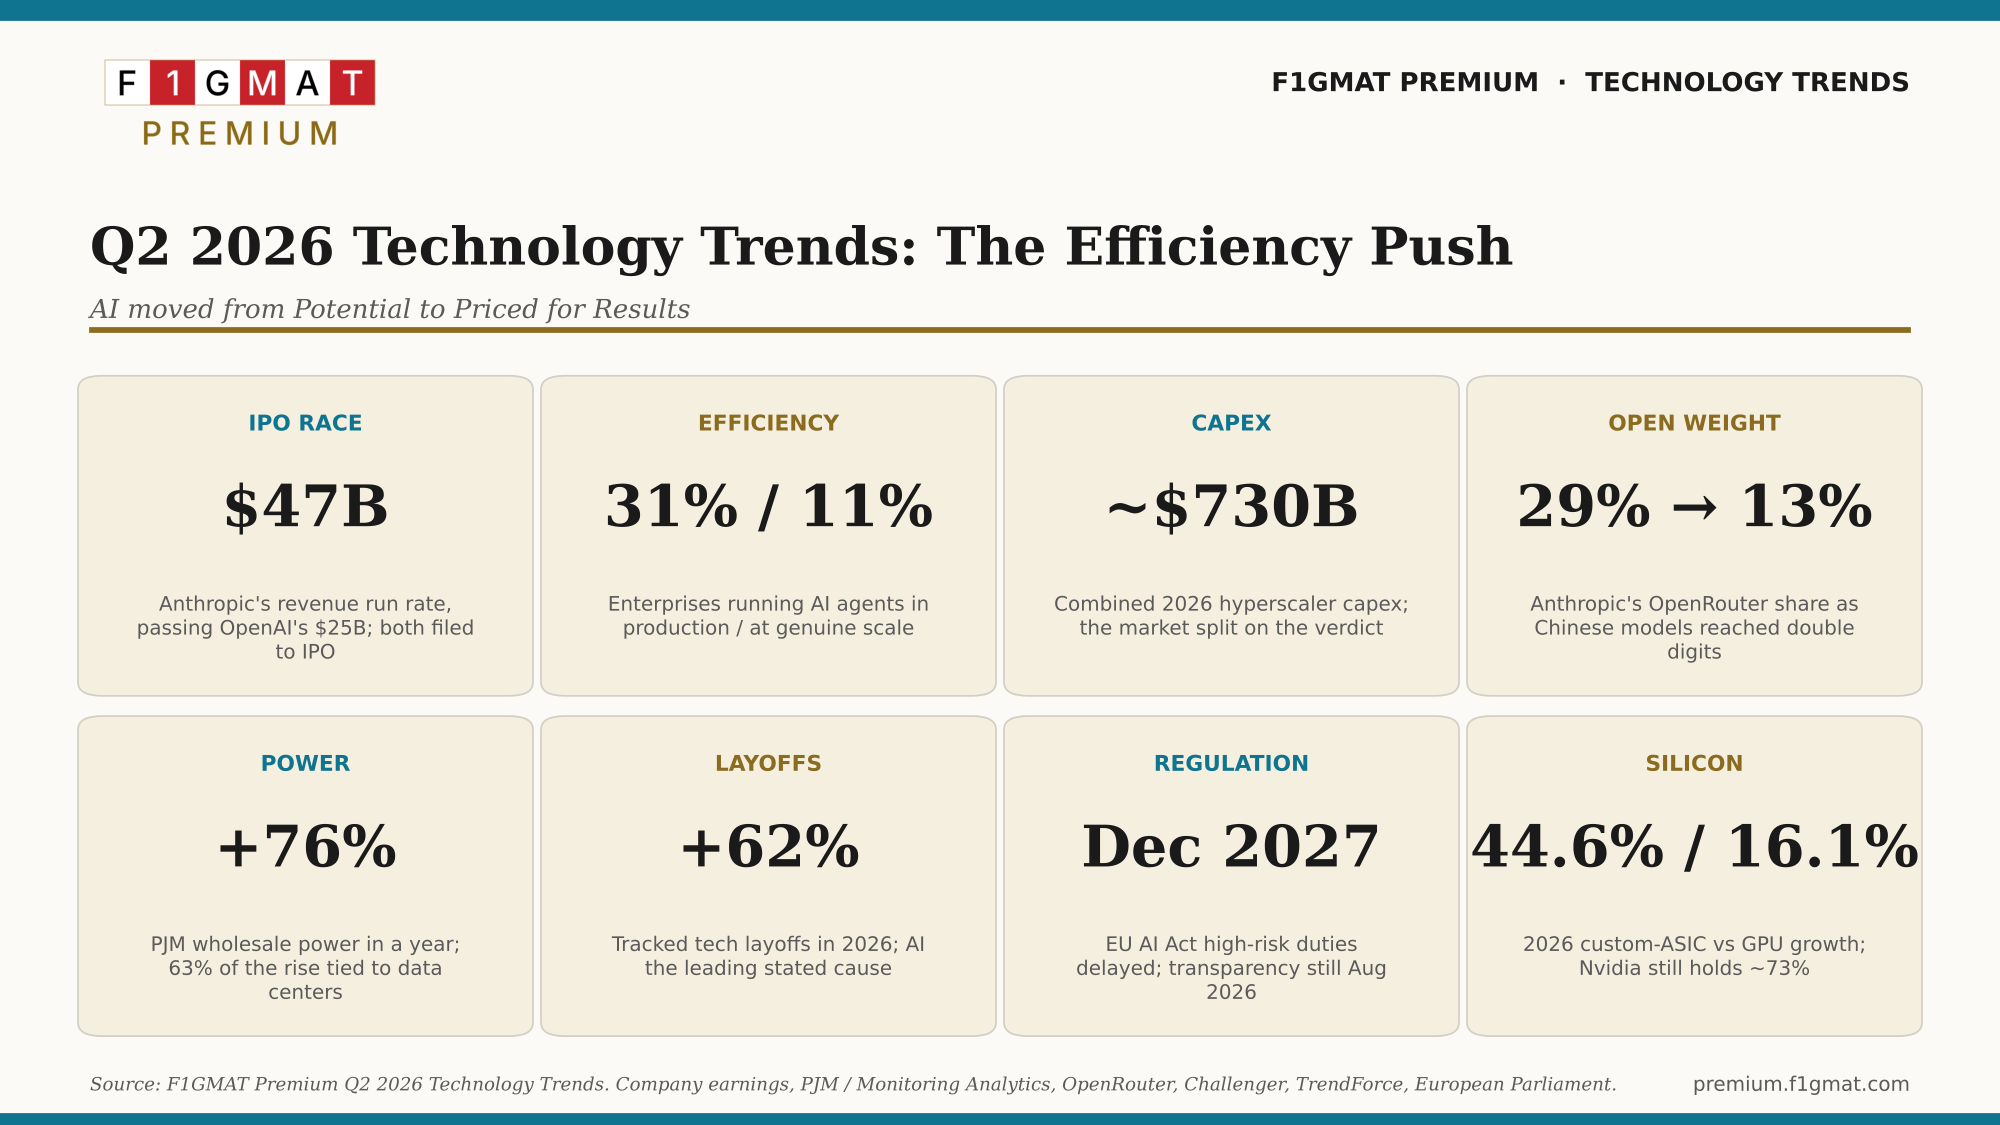
- Anthropic passed OpenAI on revenue and valuation as both labs filed confidential S-1s in June 2026.
- Hyperscaler capital spending climbed to roughly $730B to $740B for 2026, and investors responded. Meta and Alphabet fell on capex raises while Microsoft and Amazon rose on cloud reacceleration, with a $433.9B versus $149B depreciation gap building underneath.
- Enterprises moved from maximizing AI usage to cost per outcome, and agent adoption stalled near 31% in production and about 11% at genuine scale.
- Chinese open-weight models crossed double digit representation in OpenRouter tokens, led by DeepSeek at about 16.3%, while Anthropic’s share fell from 29.1% to 13.3% in a year.
- The power grid became political: PJM wholesale prices rose 76% year over year, 63% of the rise tied to data centers, and hyperscaler nuclear commitments passed $50B.
- AI became the leading stated cause of US layoffs for the first time, AI-attributed cuts reached 87,714 by May, and the damage concentrated at the entry level.
- The EU AI Act’s high-risk obligations slipped to December 2027, though transparency rules still apply from August 2026.
- Custom silicon outgrew GPUs, 44.6% against 16.1%, Broadcom emerged as the quiet winner of the ASIC boom, and Nvidia still held roughly 73% of data-center accelerator revenue.
Contents
- Trend 1: Anthropic vs OpenAI – The Margin Question
- Trend 2: Tokenmaxxing to ROI
- Trend 3: The Capex rebellion vs. Earnings test
- Trend 4: Distribution is the MOAT
- Trend 5: Energy Became Political
- Trend 6: AI is Coming for Your Jobs
- Trend 7: The EU AI Act retreat
- Trend 8: Broadcom – The Silent Winner
- References
Trend 1: Anthropic vs OpenAI – The Margin Question
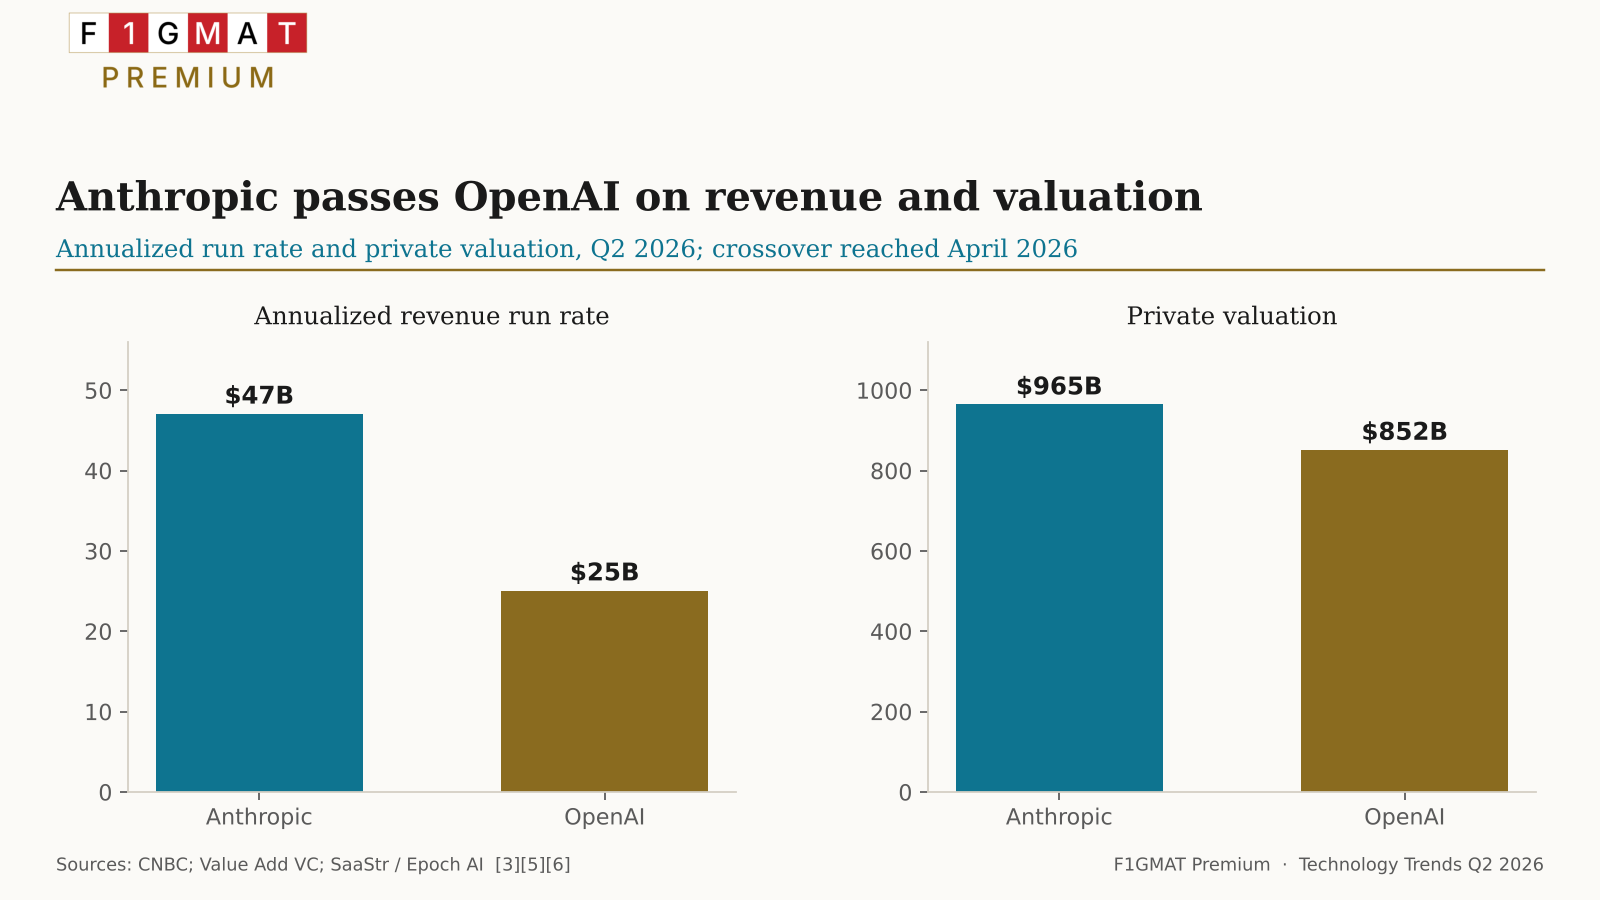
Although the IPO filings of Anthropic and OpenAI, a week apart, took most of the attention[1][2], the bigger story was the numbers Anthropic shared in the filing.
Seeing markets’ surprise at the run rate vs. revenue, we observed that Q2 2026 was the first quarter when Anthropic was profitable, posting $11.6 billion in revenue against $4.73 billion in Q1 2026.
Anthropic reported a $47 billion annualized run rate, a financial metric that multiplies – in the case of Anthropic its quarterly revenue by four.
Based on Q2 2026 numbers, the estimate is not far off, as the company also raised $65 billion Series H on May 28, 2026, which valued the company at $965 billion[3][4].
That run rate is above OpenAI’s $25 billion annualized, or about $2 billion per month, earlier in the quarter [5]. As expected to manage the huge cost in acquiring customers and data center build-outs, OpenAI closed a $122 billion funding round on March 31, 2026 at an $852 billion post-money valuation, with Amazon committing $50 billion and Nvidia and SoftBank $30 billion each [5].
While Amazon was the large technology behemoth supporting OpenAI, Alphabet’s support of Anthropic showed up in its reported earnings per share at $9.11, up 294% - an estimated $80 billion unrealized gain on its Anthropic stake after the latter’s valuation roughly tripled during the quarter [49].
Claude Code – Anthropic’s Growth Driver
The growth driver on Anthropic's side is Claude Code, the company's coding agent, which contributed roughly 54% of the AI coding market and nearly $8 billion in annualized revenue by May 2026 [4].
Right now, with the $25, $100 and $200 plans for Anthropic, according to our estimates, the company realized an estimated break-even of +5% in Q2 2026 while OpenAI's filing put its operating margin near negative 122% at $25 billion of revenue, which presents a question that underwriters often don’t face – is frontier-model training cost a temporary loss or a structural loss from which the two giants can’t recover when Recursive self-improvement (RSI) becomes the new MOAT?[5].
Trend 2: Tokenmaxxing to ROI
Throughout 2025, the goal of enterprises was to learn AI and maximize token usage, as that was the only proxy for potential AI integration.
Q2 2026 put a halt to such thinking when leadership realized that more inference without meaningful integration into operations or workflow has limited ROI.
Enterprises began limiting out-of-control token spend.
Both OpenAI and Anthropic became generous to the new behavior by giving away coupons or free 1-month extra usage for their frontier models in addition to the standard models enterprises were using[8].
Flo Crivello, chief executive of the AI startup Lindy, was the most publicized example when they moved 100% of the company's traffic from Anthropic's Claude models to DeepSeek, a Chinese provider of cheaper open-weight alternatives, to bring expenses under control [8].
More and more desperate measures will come into play when the unit economics won’t give the desired ROI with frontier models.
The lackluster adoption of AI agents in Q2 2026 also came from the same unit economics. AI agents are costly, as human-in-the-loop is the quintessential cost speed breaker in the massive disruption of industries where AI is integrated at scale.
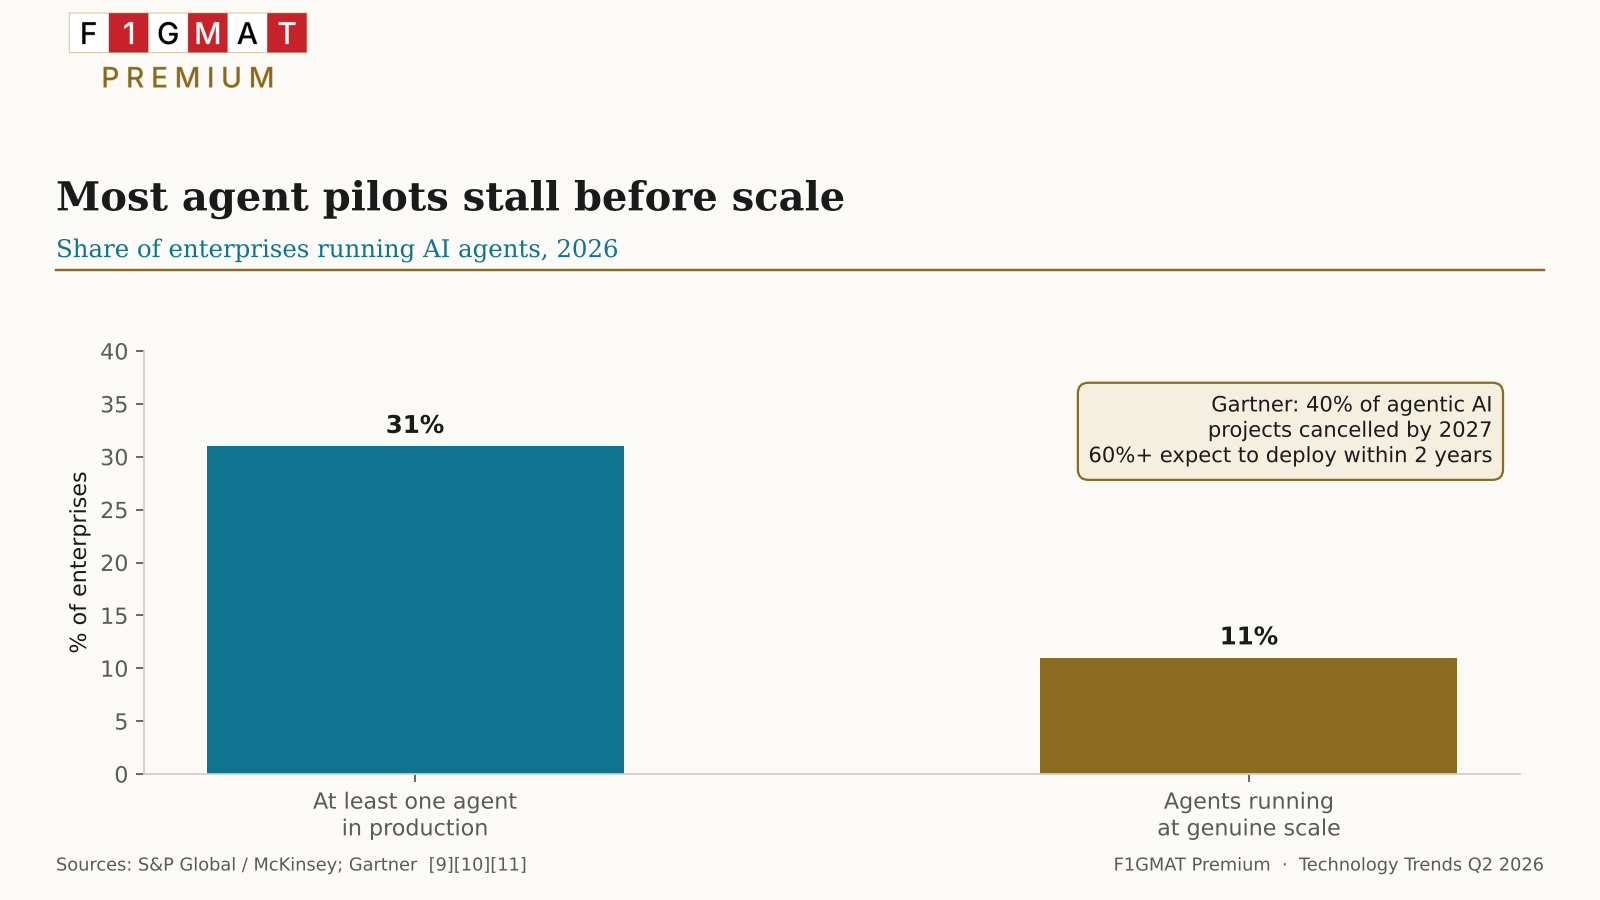
S&P Global Market Intelligence and McKinsey put the share of enterprises running at least one agent in production near 31%, with McKinsey's stricter "at genuine scale" figure closer to 11% [9][10].
Gartner's 2026 Hype Cycle for Agentic AI found only 17% of organizations had deployed agents, against more than 60% expecting to within two years, and Gartner now projects that more than 40% of agentic AI projects will be canceled by 2027 on cost and unclear return [11][12].
Where agents move from pilot to production, the cause of failure is non-technical.
An NVIDIA survey of more than 3,200 enterprises named the top causes of failure as data quality and availability (48%), shortage of AI talent (38%), and unclear return on investment (30%) [13].
Advice for Technologists
The lesson for a technologist reading this quarter is that spending more time mastering a technical stack or an agentic integration is unlikely to give you career growth or more opportunities. Writing the evaluations that prove that a workflow works, and owning the cost accounting are two equally important skills.
Trend 3: The Capex rebellion vs. Earnings test
Capital spending accelerated in Q2 of 2026, worrying investors.
Across their Q2 calls, the four largest US hyperscalers raised combined 2026 capital-expenditure guidance to roughly $730 to $740 billion, up about 78% from around $410 billion in 2025.
Amazon increased its full-year figure to $220 billion, Alphabet from $195 to $205 billion, Microsoft to $175 billion, and Meta from $130 to $145 billion [48][50][51][52].
If you add Oracle to the list, the capex of the top 5 hyperscalers is roughly $750 billion.
For 2027, the CAPEX Consensus is somewhere between $950 billion and $1.2 trillion[16][54].
Meta’s investors were divided, as we saw an early sell-off before another group of optimistic investors acquired the shares in July 2026.
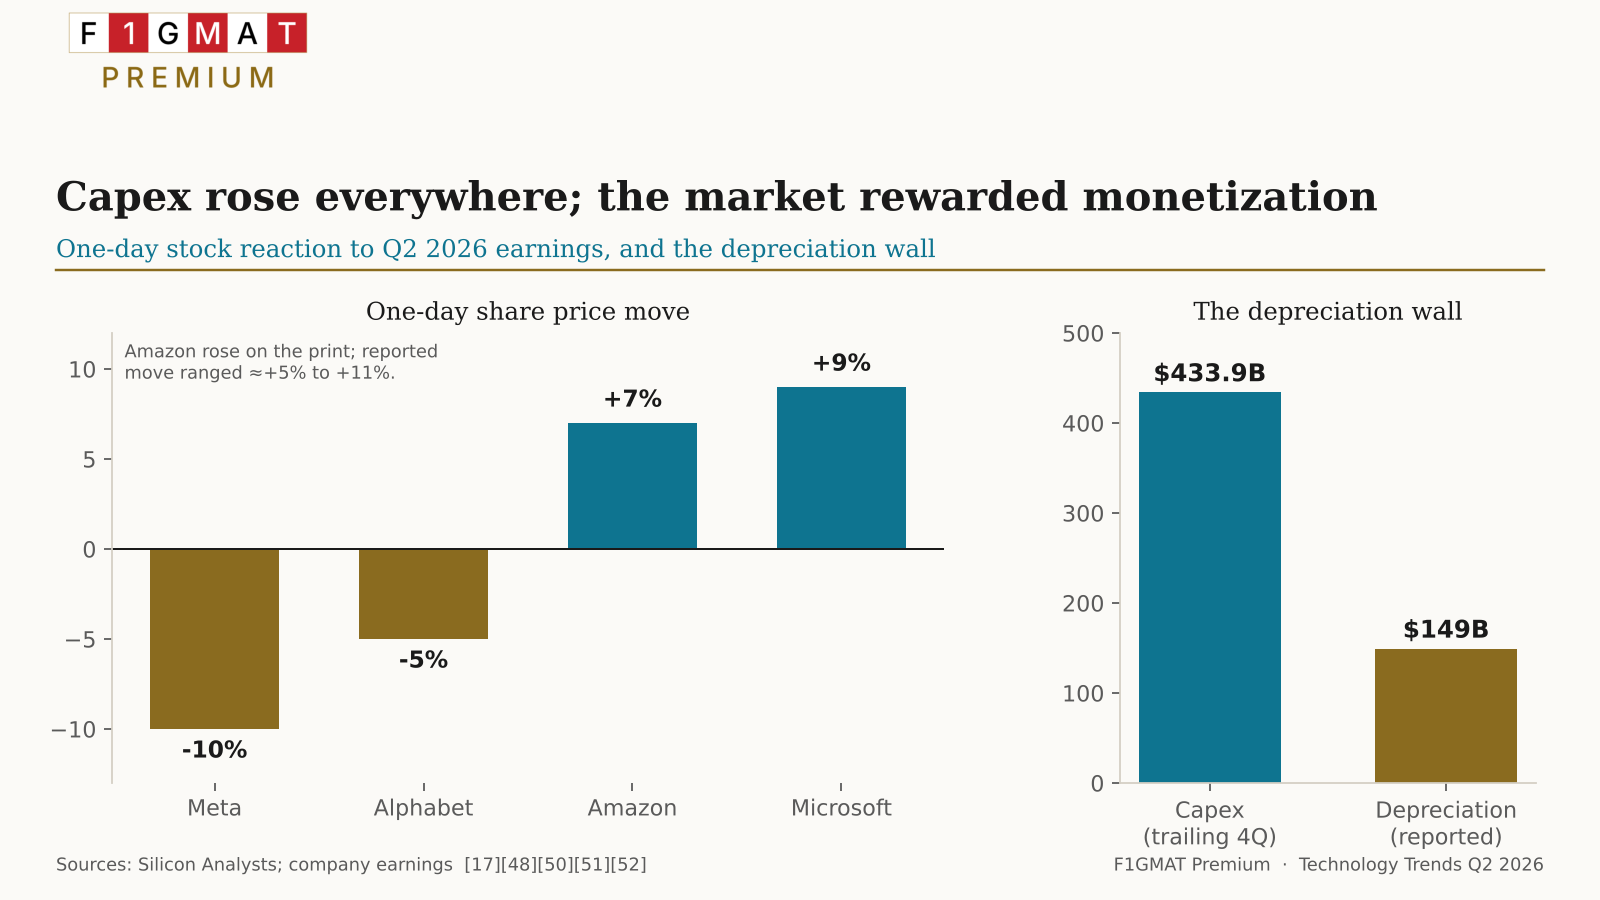
Alphabet beating estimates on revenue ($119.8 billion, up 24%), based on Google Cloud (up 82% to $24.8 billion), and on a $514 billion cloud backlog, didn’t enthuse the investors, as its shares still fell about 5% after it raised capex and reported negative free cash flow of $5.9 billion on record quarterly capex of $44.9 billion [48].
Meta grew revenue 28% to more than $60 billion yet fell nearly 10%, its second consecutive quarter met by a selloff, after it raised capex alongside a $2.4 billion legal charge and visible margin pressure [51].
Microsoft and Amazon drew the opposite reaction.
Microsoft rose about 9% on Azure growth of 43% and a commercial backlog of $678 billion, up 84%, and Amazon rose after AWS growth reached 37% to roughly $42 billion, an 18-quarter high, even as it lifted capex to $220 billion [50][52].
The four hyperscalers purchased $433.9 billion of property and equipment in the four quarters through March 2026, against roughly $149 billion of reported depreciation over the same span, because depreciation recognizes the spend across five-to-six-year server schedules and much longer building schedules [17].
It is the building schedule of data centers, from gaining permission to providing for safe water usage, along with the 5-6 year server lifetime, that forced sophisticated investors to exit these hyperscalers and find better companies.
Alphabet's Q2 free cash flow turning negative, $5.9 billion, as quarterly capex doubled, is the clearest sign yet that companies at the cutting edge of building frontier models see growth opportunities and a new paradigm of operations that investors are yet to imagine [48].
When hyperscalers couldn’t raise funds through stocks, they relied on other avenues.
Meta priced a $30 billion investment-grade bond in October 2025 plus a roughly $27 billion off-balance-sheet vehicle, Alphabet raised about $25 billion in November 2025 and roughly $31 billion more in February 2026, and Amazon added $24.9 billion in early 2026 [17].
Against an ideal capex-to-sales ratio of 3 to 8% for traditional businesses and 40 to 55% for utilities companies, 2026 capital spending at 86% of sales for Oracle, 54% for Meta, 47% for Microsoft, 46% for Alphabet, and 25% for Amazon[16] is a genuine worry about a technology bubble similar to 2001.
Advice for Technologists
Entering a hyperscaler at the wrong time would mean you are likely to face the fate of thousands during the post-pandemic cooling-off period in 2022-23, when regardless of the reputation or skills, thousands of technologists were shown the door.
Bookmark F1GMAT’s Layoff tracker in Technology and see the trends before targeting a hyperscaler.
Trend 4: Distribution is the MOAT
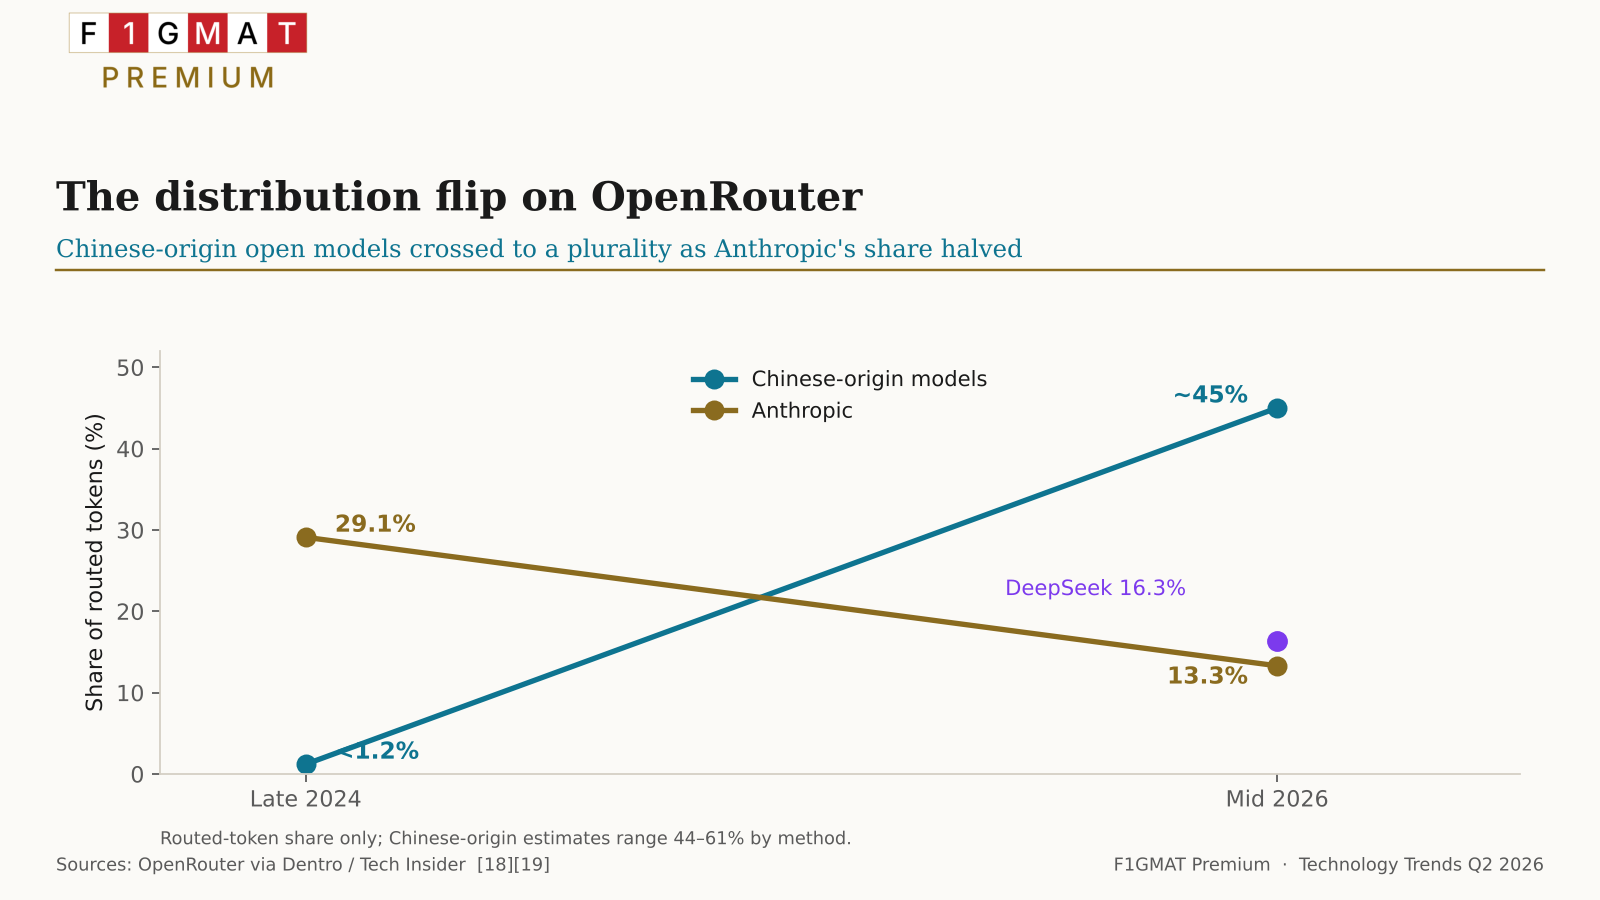
On OpenRouter, the largest neutral model-routing platform, Chinese-origin open-weight models crossed from under 1.2% of token volume in late 2024 to most of the platform's traffic by mid-2026, led by DeepSeek as the single largest provider at roughly 16.3% [18][19].
Anthropic's share on the same platform fell from 29.1% to 13.3% over twelve months, with six Chinese models now ranking above Claude by volume [18].
Meta's Llama, the open-weight leader two years earlier, dropped off the rankings entirely [20].
The response from Meta was with Muse – its personal AI agent, taking advantage of its vast social network distribution to overtake the attention of the slow-growing AI models.
Just like Microsoft’s play to sell Office Apps and Azure after dominating each desk, Meta is hoping that the 1990s play will work in the post-social media age – by being present in each mobile phone, just like WhatsApp or Instagram.
But China operates in a different universe where All-In-One Apps dominate the ecosystem. It wouldn’t be surprising that, after the fight for dominance among the big five - DeepSeek, Alibaba's Qwen, Moonshot's Kimi, Zhipu's GLM, and MiniMax [21]- one of the social networks or chat Apps will acquire the outlier and help with distribution.
DeepSeek released its V4 line (V4 Preview on April 24), and its V4 Pro variant reached 80.6% on SWE-bench Verified, a benchmark that scores a model on resolving real software issues, the top open-weights result and comparable to GPT-5.5-class agentic performance [22].
The V4 Flash variant, an MIT-licensed mixture-of-experts model of roughly 284 billion parameters with about 13 billion active and a one-million-token context window, scored 79.0% on the same benchmark at a fraction of the cost [22].
Zhipu's GLM-5.2 posted the top open-weights score of 51 on the Artificial Analysis Intelligence Index and runs at roughly one-sixth the cost of closed US frontier models [18].
Pricing Gaps – Open-Weight vs. American Models
The pricing gap can be inferred based on the open router behavior.
Claude Opus 4.8 lists near $5 per million input tokens and $25 per million output, while several Chinese open models operate well under $1 for input [18].
There is one caveat, though.
OpenRouter captures only routed API traffic and not direct API, enterprise, subscription, or self-hosted AI usage[19][23][24]. It is, at best, a leading indicator for the price-sensitive developer segment, not a measure of the whole market. But if Anthropic and OpenAI have to justify their valuation and burn rate, this segment is the exact sub-niche they should target with their cheaper models.
Advice for Technologists
The enterprise software market before the DotCom era thrived on a closed developmental ecosystem. Only with the arrival and mass adoption of open-source code did SaaS achieve scale. There is a strange correlation between the growth of the ecosystem and how open the ecosystem is. Although Meta and Microsoft are pushing for open-weight models, partly from losing out on the AI war, they understand the long-term play of building ecosystems to maintain their distribution advantages – the former in Cloud and Desktop, and the latter in social media.
Before all of you crowd Anthropic or OpenAI or wrapper companies emerging in the ecosystem, explore open-source AI development happening in the market.
The Enterprise software market before the dot-com era ran on closed, proprietary stacks.
Open-source infrastructure, Linux and the LAMP stack, lowered the cost of building and running SaaS. Although Salesforce built the first SaaS business on a proprietary database, it was the WordPress, Joomla, and Drupal ecosystem that allowed the typical mom-and-pop stores and small one-person brands to reach a global market.
The commodity layer – in the SaaS era – LAMP stack became open, while the layer that captures the money – expertise and, in an AI era, integration and domain expertise-stays closed.
Meta pioneered the open-weight release of capable large models with Llama, and Google and Microsoft now ship their own open models while hosting others on their clouds.
Anthropic keeps its weights closed to capture value at the model layer, and OpenAI has stayed largely closed apart from one defensive open-weight release.
Google and Microsoft are playing a wider game, competing across the whole stack, owning the silicon and servers beneath the model and the distribution above it.
When you target a technology company, identify the layer it actually monetizes and the margin it earns there, then weigh how durable its moat at that layer is.
In the proprietary model layer, Anthropic and OpenAI still lead, but track how fast their models are commoditized. Their lasting edge is shifting from raw model supremacy toward products such as Claude Code and deep enterprise relationships. If the majority of their $100 to $200 plans are still in the web and chat interface, the risk of commoditization increases fast.
Before you commit, find the split-up of enterprise-level reach vs. consumer-level reach.
If your strength is research, in pre-training or post-training, the frontier labs themselves are the home.
If it is applied deployment, turning models into working industry workflows, an AI-native lab or a forward-deployed engineering role will be better than traditional MBB.
If your strength is infrastructure, Amazon, Google, and Microsoft have entrenched their cloud lead, with Oracle now a fast-rising fourth on its AI-capacity deals.
If your strength is consumer AI product, the largest surfaces are OpenAI’s ChatGPT and Google’s Gemini app, as well as Meta, and a strong alternative is a startup positioned to be acquired by a tech giant.
If your strength is client relationships, serve MBB and traditional consulting firms, as influencing key decision-makers is a big part of the billing.
Trend 5: Energy Became Political
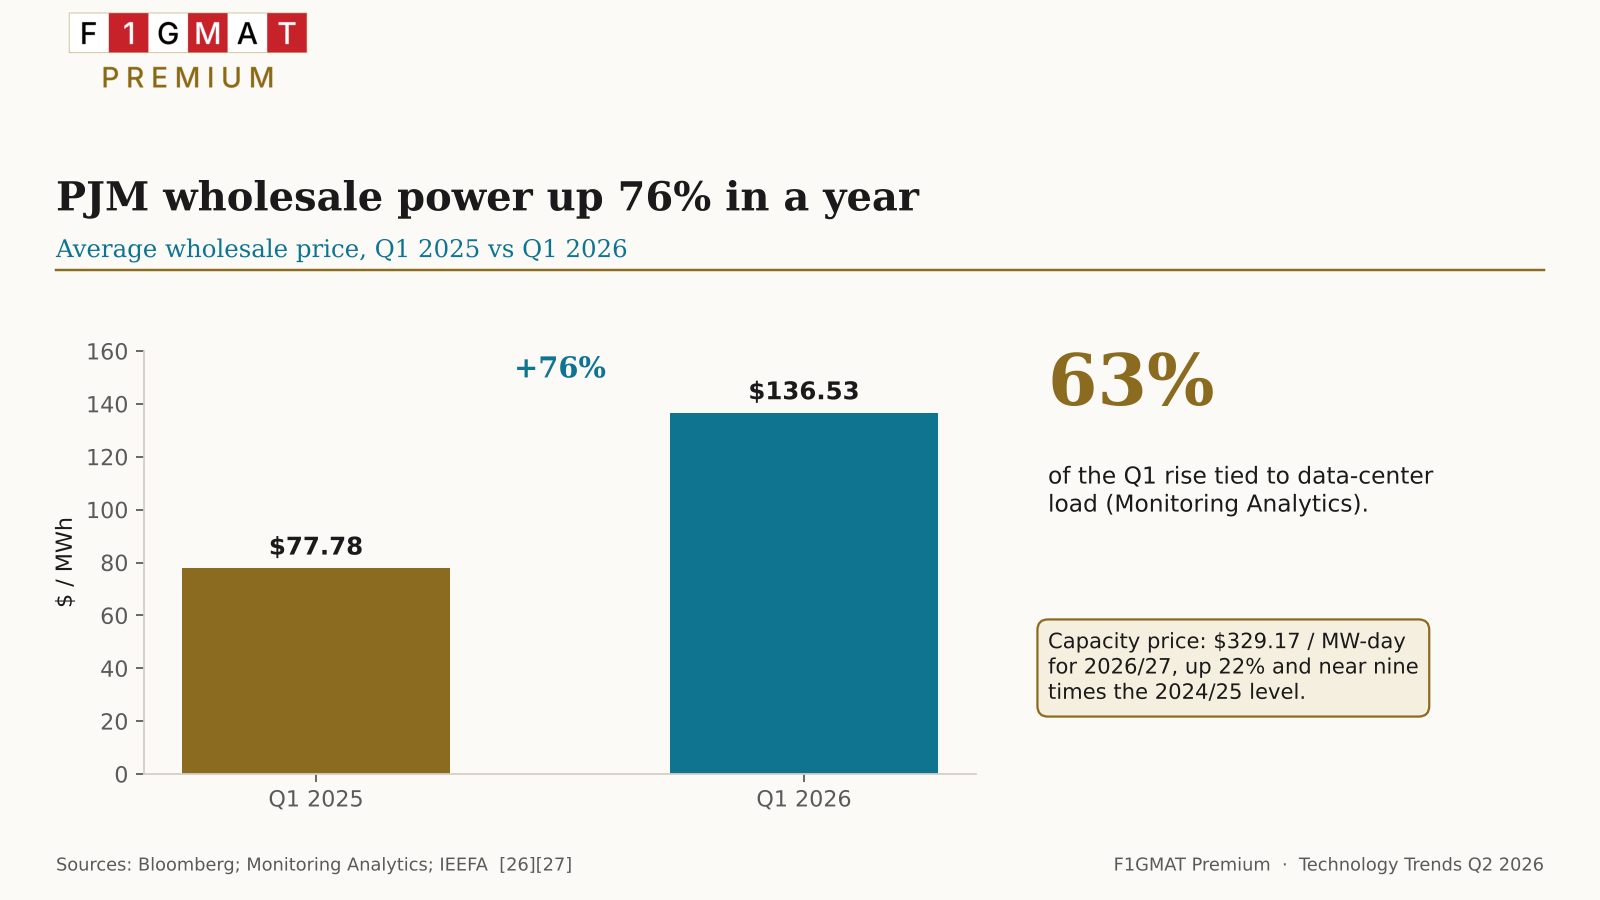
The energy constraint that Q1 described as a cost became, in Q2, a political fight over who pays.
Wholesale power on PJM Interconnection, the grid operator serving roughly 65 million people across 13 states, averaged $136.53 per megawatt-hour in the first quarter of 2026, up 76% from $77.78 a year earlier [26].
The grid's independent market monitor, Monitoring Analytics, attributed 63% of that increase to data-center load, or roughly $9.3 billion in additional costs that ratepayers will absorb over the following year [26].
On the capacity side, PJM's auction cleared at $329.17 per megawatt-day for the 2026/2027 delivery year, up 22% from the prior year and nearly nine times the 2024/2025 level, and would have cleared higher without an imposed price cap [27].
The protests of high energy costs led to a Ratepayer Protection Pledge, promoted by the current administration, asking technology firms to fund their own power infrastructure rather than socialize it through shared utility investment. Its signatories agree to rate structures under which data-center operators pay for reserved capacity whether or not they use it [28].
The pledge didn’t ease the tension as more than $64 billion in US data-center projects have been blocked or delayed by community pushback, and analysts expect at least three states to impose moratoriums on new construction by 2027 [29].
Hyperscaler’s answer to the community opposition is Nuclear.
Commitments to nuclear power passed $50 billion over eighteen months, with Amazon committing about $18 billion over 20 years for dedicated reactor access, Microsoft contracting Constellation's restart of Three Mile Island at above-market rates, and Google signing the first US corporate small-modular-reactor agreement [30].
Grid Congestion – Even with Nuclear Option
The interconnection queue, the backlog of projects waiting to connect to the grid, exceeded 2,600 gigawatts in early 2026 with waits approaching five years, and the International Energy Agency estimated that 20% of planned data-center projects globally are at risk from grid congestion [30].
Advice for Engineers
The deeper bottleneck is electrical gear - transformers and switchgear have multi-year backlogs. Manufacturing capacity is the MOAT. Any opportunities to work with manufacturers in the niche, either with operations, digitization, or technology integration, are where engineers will shine. And in this niche market, material engineers are valued over coders.
Trend 6: AI is Coming for Your Jobs
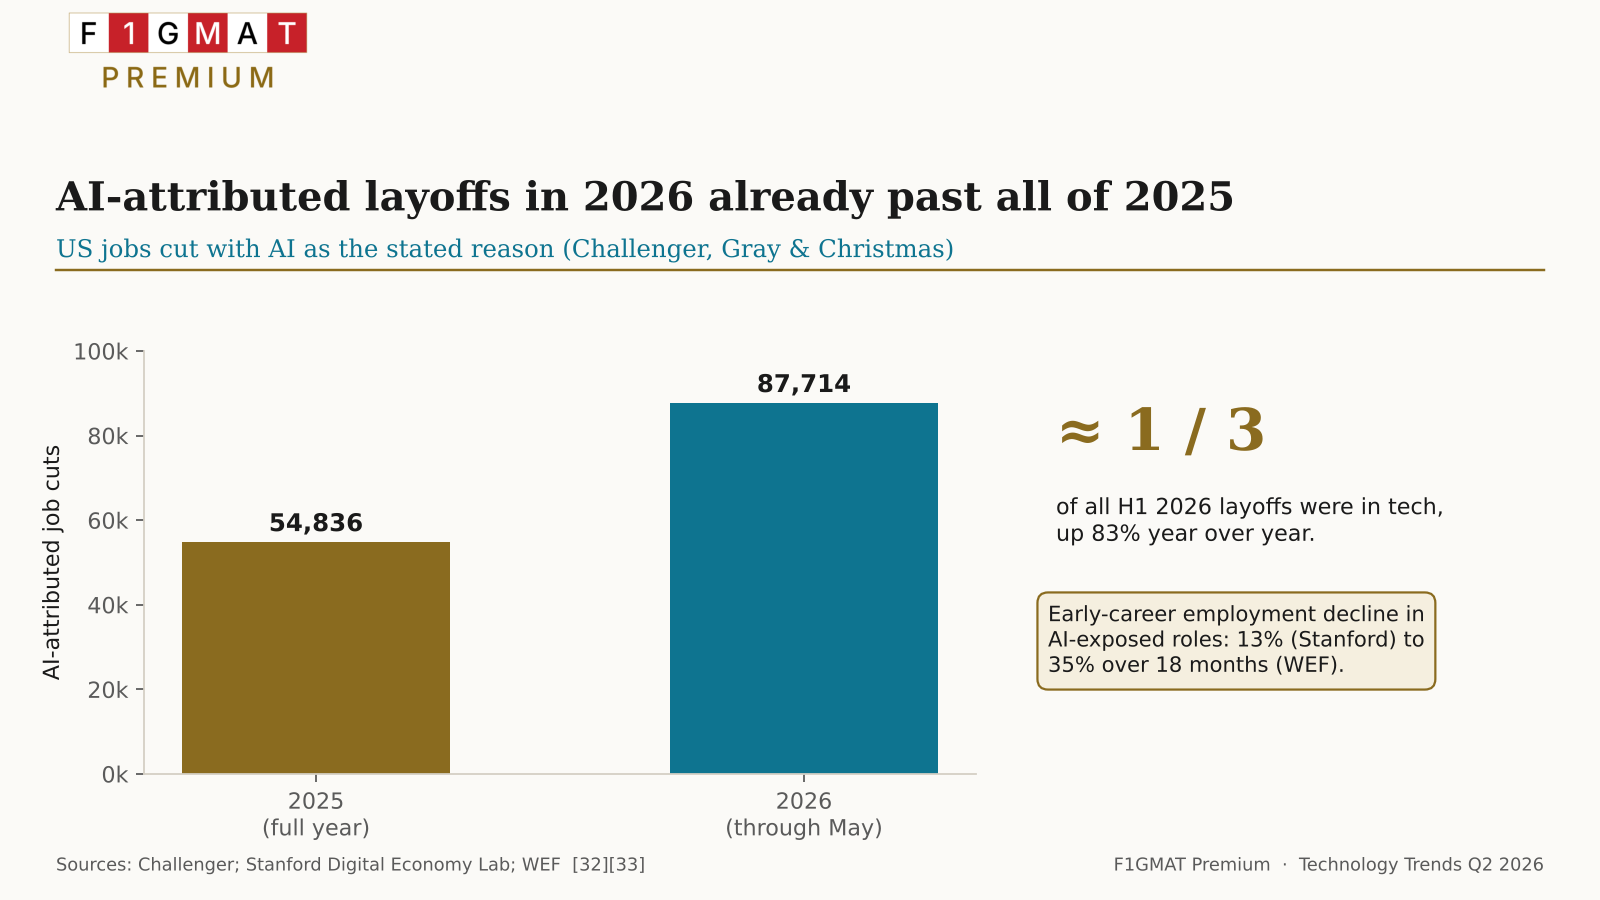
For years, "AI is coming for your job" was a fear-mongering that Hyperscalers ridiculed until 2025 happened – the layoffs were uniform across the board.
In Q2 2026, the layoff cycle restarted.
AI was the leading single stated reason US employers gave for cutting jobs in March and again in April 2026, the first time that has happened [31][32].
F1GMAT’s technology layoff tracker shows announced cuts at major employers climbing three years in a row, from 25,498 in 2024 to 40,771 in 2025 and 65,905 in 2026, each year roughly 60% above the one before, with Oracle’s 21,000 the largest single round of 2026 [31].
The damage concentrates for entry-level professionals.
The Stanford Digital Economy Lab found a 13% relative employment decline for early-career workers in the most AI-exposed roles in 2026, while the World Economic Forum figure shows a 35% decrease in employment over 18 months.
Older and more senior workers – in the mid-30s to mid-40s- largely remained untouched [33].
Recent-graduate unemployment reached 5.6% in March, per the Federal Reserve Bank of New York, above the 4.3% national rate, an unusual inversion of the normal pattern in which new graduates fare better than the broader market [34].
Advice for Technologists
The core of customer-facing skill is translation: turning a customer’s business problem into a technical solution. Monitor KPI they care about, than defining KPI based on technical perfection.
Practice problem discovery and the one-paragraph explanation. To build skills in explaining technical jargon to a non-technical market, take a technical solution you built and write it so a non-technical buyer understands why the solution matters, in plain words with a short analogy.
Do this weekly.
Get real customer exposure now. Volunteer for onboarding calls and user interviews, or ship a side project to real users.
Record your demos and calls, watch them back, and remove what the customer did not need.
Shadow a strong solutions engineer or account lead, and debrief each call with them.
Trend 7: The EU AI Act retreat
The regulatory cliff that Q1 flagged for August 2026 was pushed back.
On June 16, 2026, the European Parliament granted final approval to the Digital Omnibus on AI, a package amending the EU AI Act after a provisional agreement reached on May 6 to 7 and Council confirmation on May 13 [37][38].
The core change is a staggered deferral of the high-risk obligations.
Standalone high-risk systems in the Annex III categories, which cover employment, education, credit scoring, critical infrastructure, and law enforcement, move from August 2, 2026 to December 2, 2027, a 16-month delay, and high-risk AI embedded in regulated products under Annex I moves from August 2, 2027 to August 2, 2028 [39][40].
Most of the Act's transparency obligations stay on their original schedule, which means technology companies must declare chatbots, synthetic-media labeling, and marking of AI-generated content still apply from August 2, 2026 [41].
The deadline for Watermarking AI content for systems placed on the market moved to December 2, 2026 [39]. The amendments also added a new prohibition under Article 5 covering AI-generated non-consensual intimate imagery [40].
On July 8, 2026, the Commission concluded that its facilitated Code of Practice adequately covers the transparency obligations, and the AI Board adopted the assessment the next day, giving deployers a compliance path to evaluate against [41].
The amendments bind only once published in the Official Journal of the EU. The reach also remains broad in the GDPR sense - any AI whose output touches EU residents is in scope regardless of where the provider sits.
Trend 8: Broadcom – The Silent Winner
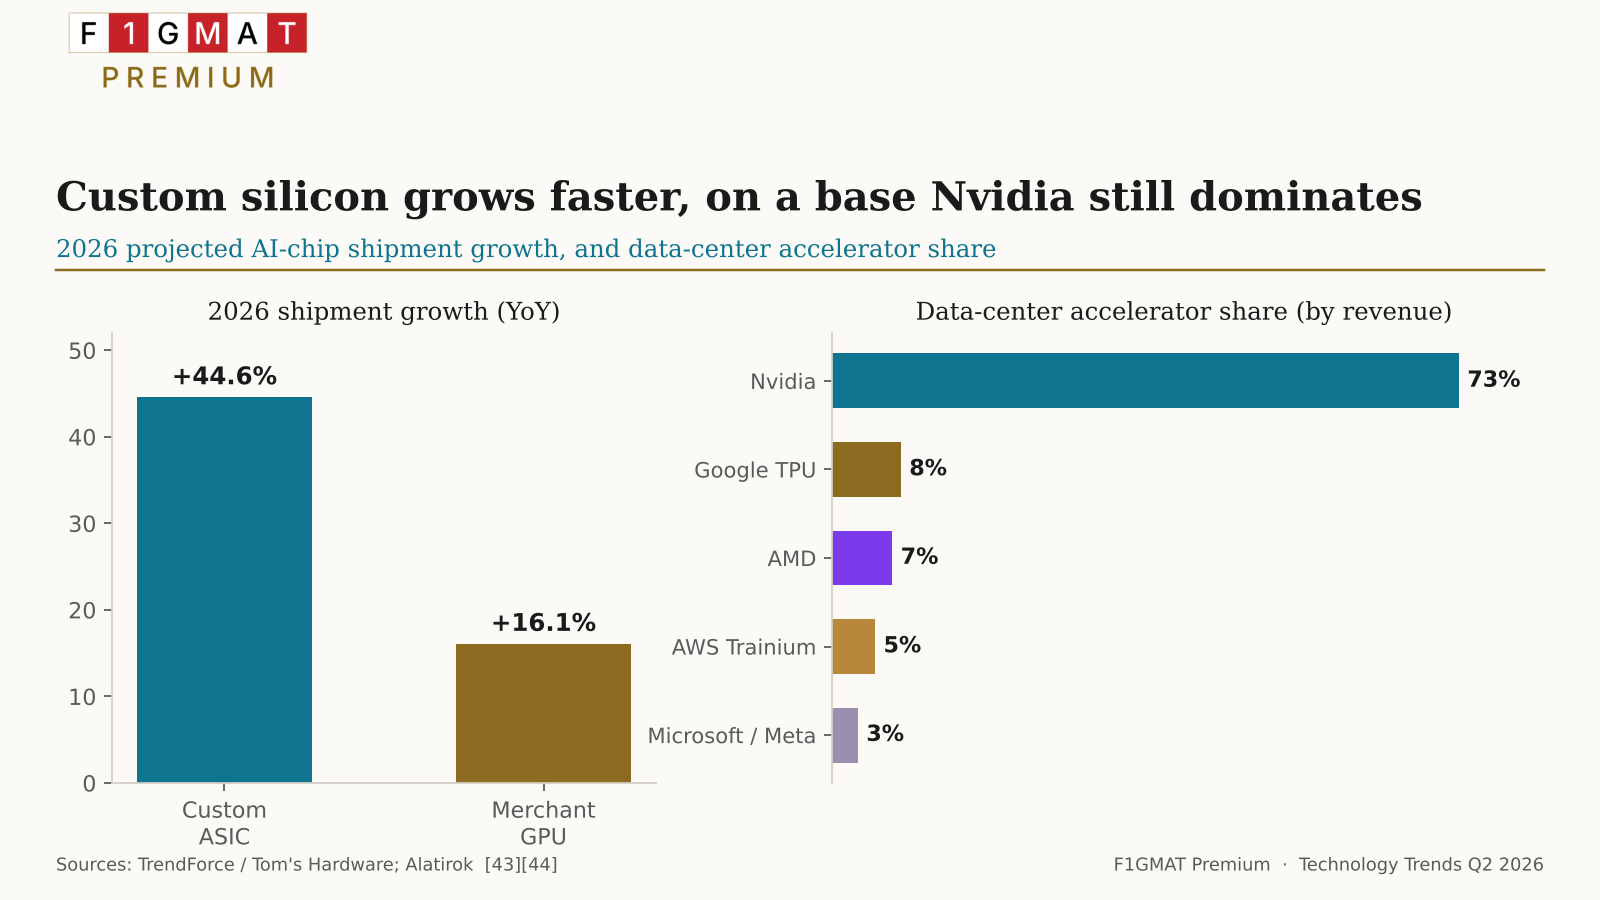
The silicon story moved from "hyperscalers build their own chips" to "hyperscalers sell them, and Broadcom collects."
Custom application-specific integrated circuits, chips designed for a fixed workload rather than general-purpose GPUs, are set to grow 44.6% year over year in 2026 against 16.1% for merchant GPUs, lifting ASIC-based AI server shipments to about 27.8% of the market, the highest share since 2023 [43].
Nvidia still holds roughly 70 to 80% of data-center accelerators by revenue, and its absolute scale is widening even as that percentage share erodes. Its fiscal second quarter ended July 26, 2026, posted $96.2 billion in total revenue, up 106% year over year, with the Data Center segment alone at $89.0 billion, up 117%, and management guided the next quarter to $108 billion [53].
That single-quarter Data Center figure annualizes above $350 billion, close to double the $193.7 billion of the prior full fiscal year, which is what "the market doubled underneath it" means in practice - custom-ASIC share is rising on a base that is itself expanding fast [45][53].
The silent winner is Broadcom.
It reported $8.4 billion in AI semiconductor revenue for the first quarter of fiscal 2026, up 106% year over year, carries a backlog reported near $73 billion, and targets $100 billion in annual AI chip revenue by 2027 [46][43].
Broadcom and Marvell together hold an estimated 95% of the custom-ASIC co-design market, the engineering work that turns a hyperscaler's chip specification into manufacturable silicon [46].
Every one of these chips is fabricated at TSMC, which produces roughly 92% of advanced AI chips at 7nm and below and runs its 3nm line at full utilization, with demand estimated at about three times supply [45].
The pivot in Q2 is that Google runs more than 75% of Gemini on its own TPUs, projects 4.3 million TPU shipments in 2026, and has begun selling them to select customers for their own data centers, while Amazon, whose Trainium already processes more than half of Bedrock's token throughput, signaled it may sell Trainium externally [45][47].
For a buyer, most hyperscaler ASICs remain rentable only inside their owner's cloud [43].
Advice for Engineers
Don’t get locked into CUDA.
CUDA is Nvidia’s proprietary software stack, the programming model plus the libraries and compilers (cuDNN, cuBLAS) that almost every AI framework is built on, and it runs only on Nvidia hardware. Moving a workload to cheaper silicon means rewriting the low-level code and re-tuning performance from scratch. It is Nvidia’s deepest moat, worth more than the chips themselves.
As silicon fragments across TPU, Trainium, Maia, and AMD, the payoff for breaking that dependency grows, because hyperscalers want their own accelerators to run the workloads already written for Nvidia.
The escape routes are the abstraction layers above the hardware, such as OpenAI’s Triton for writing a kernel once and the PyTorch compile stack with OpenXLA for retargeting a model across chips.
The scarce skill is making a model run well on hardware it was not written for. The compensation is top 1%.
References
- FutureSearch, "OpenAI Revenue Forecast" (OpenAI confidential S-1 filed June 8, 2026). ↩
- AI Business Weekly, "Anthropic Statistics 2026" (Anthropic S-1, valuation, IPO timing). ↩
- CNBC, "OpenAI, Anthropic new AI spending reality" (Anthropic $47B run rate reported May). ↩
- AI Business Weekly, "Anthropic Statistics 2026" (Series H $65B, $965B valuation, Claude Code 54%). ↩ ↩
- Value Add VC, "OpenAI Revenue 2026" ($25B ARR, S-1 June 8, -122% margin, $122B round, $852B valuation). ↩ ↩ ↩
- SaaStr, "Anthropic Just Passed OpenAI in Revenue" (April crossover, Epoch modeling).
- Lambda Finance, "Anthropic vs OpenAI Revenue 2026" (OUTLIER low figures — flag only).
- CNBC, "users shift from tokenmaxxing to efficiency" (Lindy to DeepSeek). ↩ ↩
- Digital Applied, "AI Agent Adoption 2026" (31% production, banking 47%; S&P Global / McKinsey). ↩
- LumiChats, "97% Deployed, 11% Using" (McKinsey 11% at scale, S&P 31%). ↩
- To The New, "Enterprise AI Agents in Production" (Gartner Hype Cycle: 17% deployed, >60% within two years). ↩
- GoGloby, "AI Adoption Statistics 2026" (Gartner: >40% agentic projects cancelled by 2027). ↩
- The Daily Brief, "89% of AI Agent Pilots Never Scale" (NVIDIA survey of 3,200+; blockers). ↩
- Yahoo Finance, "Hyperscalers Hit $700 Billion in 2026 AI Spending" (Meta raise + 9% drop, MSFT $37B run rate, Nvidia Q4 DC $62.31B).
- Value Add VC, "$725B AI Capex 2026" (per-company breakdown).
- CreditSights, "Raising Hyperscaler Capex 2026 Estimates" (~$750B top-5, capex-to-sales ratios). ↩ ↩
- Silicon Analysts, "Hyperscaler AI Capex Depreciation Wall 2026" ($433.9B trailing capex, ~$149B depreciation, bond deals). ↩ ↩
- Tech Insider, "Chinese AI Models Top OpenRouter; Claude at 13.3%" (DeepSeek 16.3%, Anthropic 29.1% to 13.3% via Dentro; GLM-5.2 51 index, ~1/6 cost via Reuters; Claude Opus 4.8 pricing). ↩ ↩ ↩ ↩
- KuCoin / Global Times, "OpenRouter Data Shows 61% of Token Consumption by Chinese AI Models" (<1.2% late 2024 to 51% April 2026). ↩ ↩
- Datagravity, "China's Open-Weight Takeover" (distribution-flip reframe; Llama off rankings). ↩
- Robofutur, "China's open-weight AI race in 2026" (five families; four models April to June). ↩
- OpenRouter Blog, "The Open Weight Models that Matter: June 2026" (DeepSeek V4 Pro 80.6% / Flash 79.0% SWE-bench, specs). ↩ ↩
- OfficeChai, "Most Popular AI Model Companies on OpenRouter June 2026" (~44% top-ten). ↩
- João Queirós, "China's Open-Weight AI Strategy" (OpenRouter-is-one-slice caveat; Kimi K3 / Qwen 3.8 status). ↩
- ExplainX, "Qwen 3.8 Max Preview" (SWE-bench audit / vendor self-reporting caveat, July 2026).
- The AI Consulting Network, "PJM Power Prices Up 76%" (Bloomberg May 14: $136.53 vs $77.78/MWh; Monitoring Analytics 63% / $9.3B). ↩ ↩
- IEEFA, "Projected data center growth spurs PJM capacity prices by factor of 10" ($329.17/MW-day 2026/27, +22%, ninefold; price cap). ↩
- Tech Insider, "The AI Data Center Power Crisis" (Ratepayer Protection Pledge; Goldman inflation; retail +2.3%). ↩
- Informed Clearly, "AI Power Crunch" ($64B+ blocked; moratorium projection; PJM demand attribution). ↩
- Informed Clearly, "AI Data Centers Hit Grid Wall: Big Tech Pivots to Nuclear" ($50B+ nuclear, Amazon $18B/20yr, 2,600GW queue, IEA 20% at risk). ↩ ↩
- F1GMAT's Layoff Tracker in Technology Industry. ↩ ↩
- The Lonely Entrepreneur, "AI Entry-Level Jobs" (Challenger: AI #1 cause; 87,714 H1 vs 54,836 all-2025; tech ~1/3, +83%). ↩
- Stanford Digital Economy Lab 2026, via The Lonely Entrepreneur (13% early-career decline; WEF up-to-35% comparison). ↩
- CNBC Select, "Class of 2026 Hiring Stats" (NY Fed 5.6% grad unemployment; NACE 35%; Handshake 4.2%). ↩
- Team Blind / Bloomberg, "IBM tripling entry-level hiring in the US."
- IntuitionLabs, "AI's Impact on Graduate Jobs" (McKinsey +12% hiring).
- Morgan Lewis, "EU Approves Delays and Other Amendments" (Parliament final approval June 16, 2026; deferral dates). ↩
- Bright Defense, "EU AI Act Delay Keeps 2026 Compliance Pressure" (Omnibus timeline: proposal Nov 19 2025, provisional May 7). ↩
- Morgan Lewis (Annex III to Dec 2 2027; Annex I to Aug 2 2028; watermarking to Dec 2 2026). ↩ ↩
- Covington Inside Privacy, "EU AI Act Update: Timeline Relief, Targeted Simplification, and New Prohibitions" (two-tier deferral; Article 5 nudifier/CSAM prohibition). ↩ ↩
- Jones Walker, "Yes, August 2 Still Matters" (transparency obligations remain; Code of Practice adequacy July 8-9). ↩ ↩
- Gibson Dunn, "EU AI Act Omnibus Agreement" (binds only on Official Journal publication; Aug 2 2026 remains live).
- Tom's Hardware, "The custom AI ASIC state of play (May 2026)" (+44.6% vs +16.1%; 27.8% share; Broadcom $73B backlog; Anthropic 1M TPUs; Google 4.3M shipments). ↩ ↩ ↩
- Alatirok, "AI Chip Market Share 2026" (Nvidia ~73%; TPU ~8%; Trainium ~5%; Maia/MTIA ~3%; AMD ~7%).
- Silicon Analysts, "AMD vs NVIDIA AI GPU Market Share 2026" (Nvidia ~80% / $193.7B FY26 DC revenue; Gemini >75% on TPU; Trainium >50% of Bedrock; TSMC concentration). ↩ ↩ ↩
- Tech Times, "Custom AI Chips Outpace Nvidia GPU Growth" (Broadcom $8.4B Q1 FY26 AI revenue +106%; Broadcom+Marvell 95% co-design). ↩ ↩
- Digital Applied, "Amazon May Sell Its AI Chips" (Google TPU external sales; Amazon considering external Trainium; 10-20% by end-2026). ↩
- Alphabet Q2 2026 (8-K filed July 22, 2026): revenue $119.8B +24%, Google Cloud +82% to $24.8B, backlog $514B, record quarterly capex $44.9B, free cash flow -$5.9B, 2026 capex guidance raised to $195-205B, shares down ~5% after hours. InsiderFinance / CNBC. ↩ ↩ ↩
- Alphabet Q2 EPS and Anthropic stake mark: reported EPS $9.11 (+294%) inflated by an estimated ~$80B unrealized gain on the Anthropic stake after its valuation roughly tripled, not core operations. Trader Central. ↩
- Microsoft fiscal Q4 2026 (reported July 29, 2026): revenue $90.0B +18%, Azure +43%, AI run rate $37B (+123%, April), FY2026 capex $115.9B (cash additions to P&E), Q4 capex ~$41B incl. leases, commercial RPO $678B +84%, shares up ~9% after hours. Microsoft IR / Windows Forum. ↩ ↩
- Meta Q2 2026 (reported July 29, 2026): revenue +28% to more than $60B, 2026 capex guidance raised to $130-145B, $2.4B legal charge, shares down ~10% on monetization-timeline scrutiny and margin pressure. Meta IR / Variety / Investing.com. ↩ ↩
- Amazon Q2 2026 (reported July 31, 2026): AWS growth 37% to roughly $42B (18-quarter high), 2026 capex guidance raised to $220B, shares up on the print. Amazon IR / Forbes. ↩ ↩
- NVIDIA second quarter fiscal 2027 press release (quarter ended July 26, 2026): total revenue $96.221B +106%, Data Center $89.0B +117%, Q3 FY27 guidance $108.0B ±2% (no China Data Center compute assumed). NVIDIA Investor Relations. ↩ ↩
- CryptoBriefing, "Amazon, Meta, Microsoft stocks surge after strong AI earnings as hyperscaler capex nears $725B" (combined four-company 2026 capex ~$725B; 2027 projected $950B-$1.2T; per-company stock reactions). ↩